Trend and seasonality decomposition with Prophet
December 28, 2018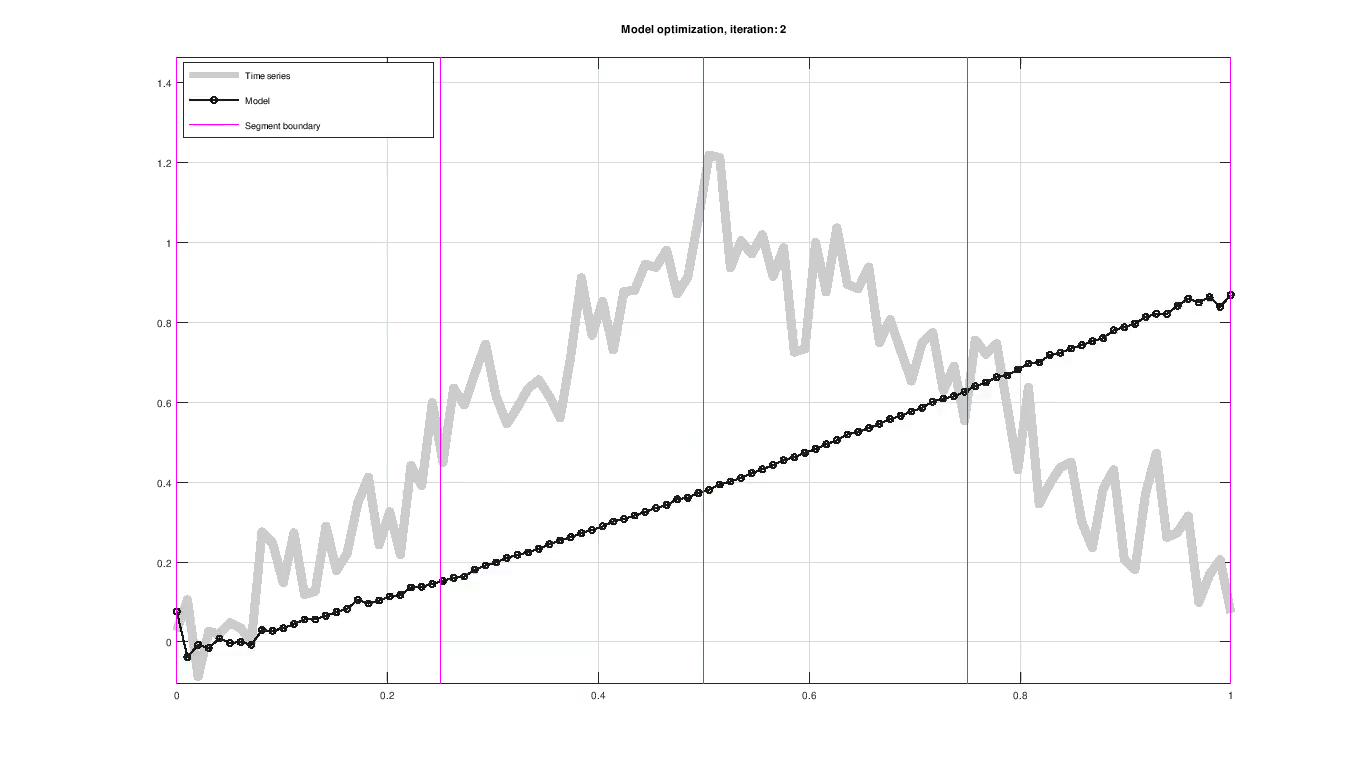 Figure: Piece-wise trend and seasonal model fitting of a sample time series.
Prophet is a statistical approach, presented in [1], to fit and forecast time series by decomposing the data into trend, seasonality and holiday components. The trend represents growth, while seasonality incorporate periodic effects within the trend and holiday effects capture sudden events that are predictable in time (as in when they occur). For example, usage on social media is seen as an ever growing process with daily, weekly and monthly variations and drastic changes around i.e. Christmas and sporting events. The goal of this article is to explore decomposable models for time series application based on Prophet. Please note that the goal of Prophet is ultimately to make forecasts into the future while this article is focused entirely on the modelling part (on which forecasting is based). For the sake of brevity, holiday effects are not considered here.
Modelling and forecasting in Prophet falls somewhere between fully automated and hand-tuned procedures. Paper [1] explores this approach by arguing that fully automated procedures may fail due to their complexity and hand-tuned models are subject to over-fitting. It highlights one of Prophet’s key properties, which is to have intuitive parameters (e.g. easily expressible in terms of the time series) without requiring detailed knowledge about the underlying model.
In this article
- Presentation of the model used in Prophet.
- Parameter likelihood formulation and optimization.
- Visualization of some sample and benchmark time series.
It is assumed that the reader is somewhat familiar with Bayesian probability concepts such as likelihood, prior and posterior distributions - although this article does not mention them explicitly. Also, familiarity with likelihood optimization is beneficial but suggested reading on this topic is provided.
Composite model
Prophet uses a decomposable time series model consisting of: trend, seasonal effects and holiday effects. This article focus only the trend and seasonality:
$$ y(t) = s(t) + g(t) + \epsilon(t) $$.
where $y(t)$ is the time series, $s(t)$ is the seasonal variation, $g(t)$ is the trend and $\epsilon(t)$ is the model residual. The analyst is involved in selecting certain design parameters based on observation or experience.
The trend is modelled by either logistic or linear growth. Linear growth is represented as:
$$ g(t) = kt + m $$
where $k$ is the slope and $m$ is the intercept. In the following examples, only linear growth is used.
Seasonal variations are modelled using Fourier series
$$ s(t) = \sum_{n=1}^N\left( a_n cos\left(\frac{2\pi n t}{P}\right) + b_n sin\left(\frac{2\pi n t}{P}\right) \right) $$
where the design parameters are the $2N$ Fourier coefficients $\beta = [a_1, b_1, … , a_N, b_N]$. In other words, the optimal choice of weights are sought that fits periodic functions to the seasonal variation. $P$ should be set to an appropriate seasonal variation that the model is expected to have i.e. $P = 7$ for weekly data. $N$ provides an upper limit to the frequencies the model is able to resolve where higher frequencies will be aliased (the authors describe this as applying a low-pass filter attempting to capture explainable variations only).
Piece-wise models
So far, time series data is modelled by a line plus a sum of periodic functions. From this, the model can be easily extended to support piece-wise models, each having its own set of parameters. Take for example a dataset where a certain trend and seasonality regime is driving the data during a subset of the year and is expected to switch at some point later in the year. These points in time are denoted $c_j$ and can span any time duration although it is required that $c_1 < c_j< c_S$.
In order to incorporate the changepoints, a useful transition from one segment of the model to another is required. The trend, $g(t)$, is extended to accommodate for the change of slope in each segment:
$$ g(t) = k + \sum_{j=1}^{c_j < t} \delta_j + m$$.
where $\delta_j$ is defined for each piece-wise model. In the figure below and at the top of the page, the changepoints are highlighted with a purple vertical line. Changepoints can be specified manually or selected randomly.
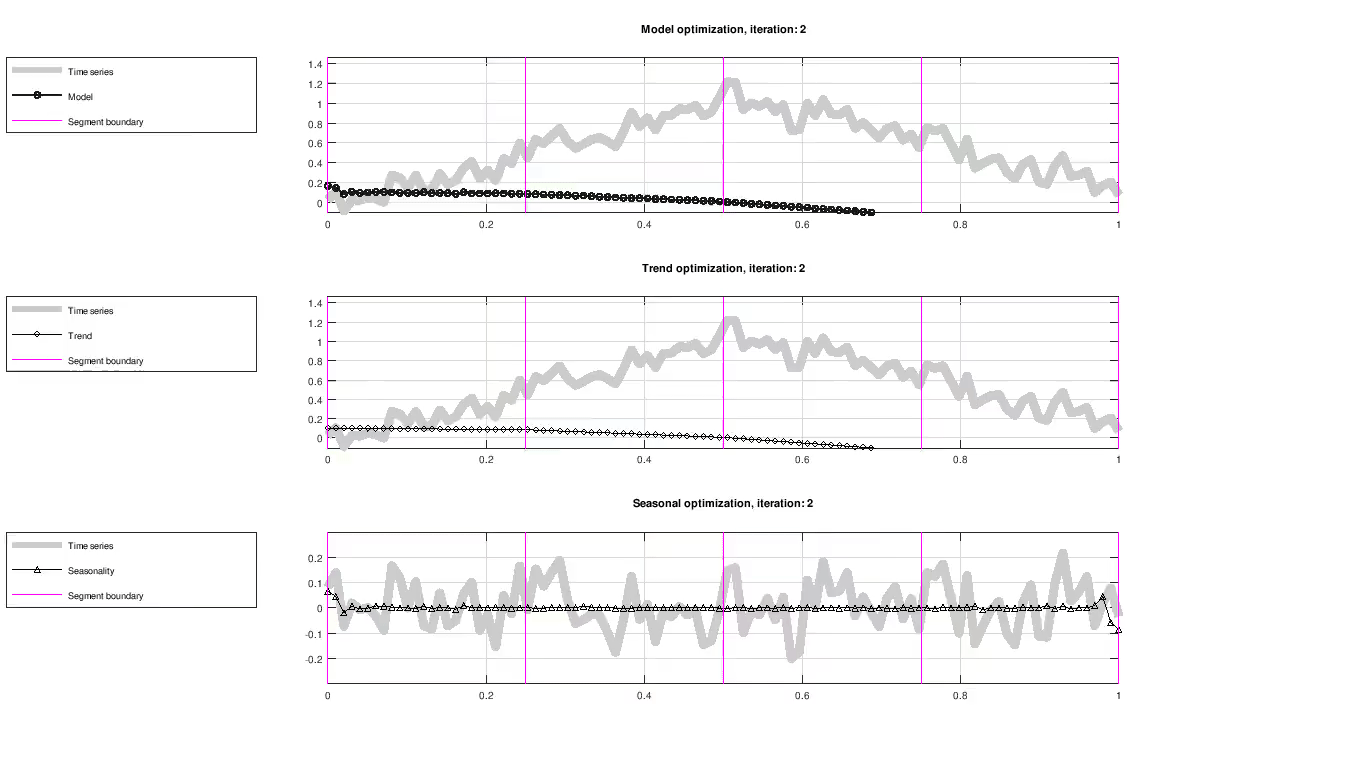 Figure: Evolution of trend and seasonality, showing full model fit (top), trend component (middle) and seasonal component (bottom). The seasonal component has been centered around zero for visualization purposes only.
Before moving forward it should be mentioned that the paper discuss a way to formulate this model as a matrix in order to apply an optimization scheme for computing the model parameters. The implementation of this formulation is also readable in the STAN source code.
Computing the model fit
Up to this point, the model has only been proposed in terms of the trend and seasonal component without any concern to how the model parameters are determined. Parameters are evaluated using their likelihood and improved iteratively using an optimization scheme, as seen in the figure above. The optimization scheme used here is maximum a posteriori estimation (MAP).
Fitting the model involves two steps. Firstly, initial parameter values must be chosen based on assumptions on how they are distributed. Secondly, the objective function is defined using the likelihood as a function of parameters and the time series.
Selecting initial guesses (priors)
For model fitting, parameters are given an initial guess using the priors:
- $k \sim \mathcal{N}(0, 0.5)$
- $m \sim \mathcal{N}(0, 0.5)$
- $\delta \sim Laplace(0, \tau)$
- $\beta \sim \mathcal{N}(0, \bar{\sigma})$
where $\tau$ and $\bar{\sigma}$ are design parameters. Note that $\bar{\sigma}$ is a vector. Its values are drawn for every model segment. The initial guess affect how fast the model fit is computed but can also cause the model fit to settle for non-optimal solutions e.g. finding a local optimization minimum.
Model likelihood
The likelihood of the model $\theta =[k, m, \delta_1, … , \delta_S, \beta] = [k, m, \delta_1, … , \delta_S, a_1, b_1, … , a_N, b_N]$ is computed as the product of the likelihood of each time series sample. This means computing the model fit $\hat{y}(t) = g(t, k, m, \delta) + s(t, \beta)$ and taking the difference between observed (time series) and model data $y(t) - \hat{y}$. If $\hat{y}(t)$ was fit using likely parameters $\theta$, then the residual is expected to be small. In fact, if the model is correct then the residual $y(t) - \hat{y}(t)$ is equal to the model noise $\epsilon(t)$. More formally, the observations $y(t)$, model fit $\hat{y}(t)$ and noise covariance (matrix) $\Sigma$ are inputs to the likelihood function of the multi-variate normal distribution:
$$ ln(L) = - \frac{1}{2} [ln(|\Sigma|) + (y - \hat{y})^{T}\Sigma^{-1}(y - \hat{y}) + n; ln(2\pi)] $$
The log-likelihood used above is preferred over the regular likelihood function for convenience.
Example: likelihood for the slope of the trend
Imagine a time series samples from a pure linear trend having slope $k = 0.032$. Imagine also that the time series have no seasonality, that is $\theta = [k]$. The time series data at $t = 1$ is $y(t) = 0.032*1 = 0.032$. Our initial estimate of the slope is drawn $\hat{k} = Laplace(0, 0.5) = 0.5$. The sample at $t = 1$ would have likelihood
$$ ln(L) = -; \frac{1}{2} [ln(0.5) + (0.5 - 0.032)\times \frac{1}{0.5} \times(0.5 - 0.032) + 1 \times ln(2\pi)] =-0.791 $$
using $\Sigma = 0.5$ as model noise. While an improved estimate $\hat{k} = 0.41$ would yield
$$ ln(L) = -; \frac{1}{2} [ln(0.5) + (0.41 - 0.032)\times \frac{1}{0.5} \times (0.41 - 0.032) + 1 \times ln(2\pi)] = -0.572 $$
which is a small improvement.
Optimization
The model likelihood is optimized using parameter vector $\theta$. [1] uses the quasi-Newton optimization method L-BFGS. L-BFGS estimates the second derivative (the Hessian to be more accurate) and can be found in many optimization software frameworks.
The figure below shows the result of fitting trend and seasonality using L-BFGS on the Airline passenger dataset [2]. All results in this article were created using a custom C++ implementation.
Airline passengers dataset
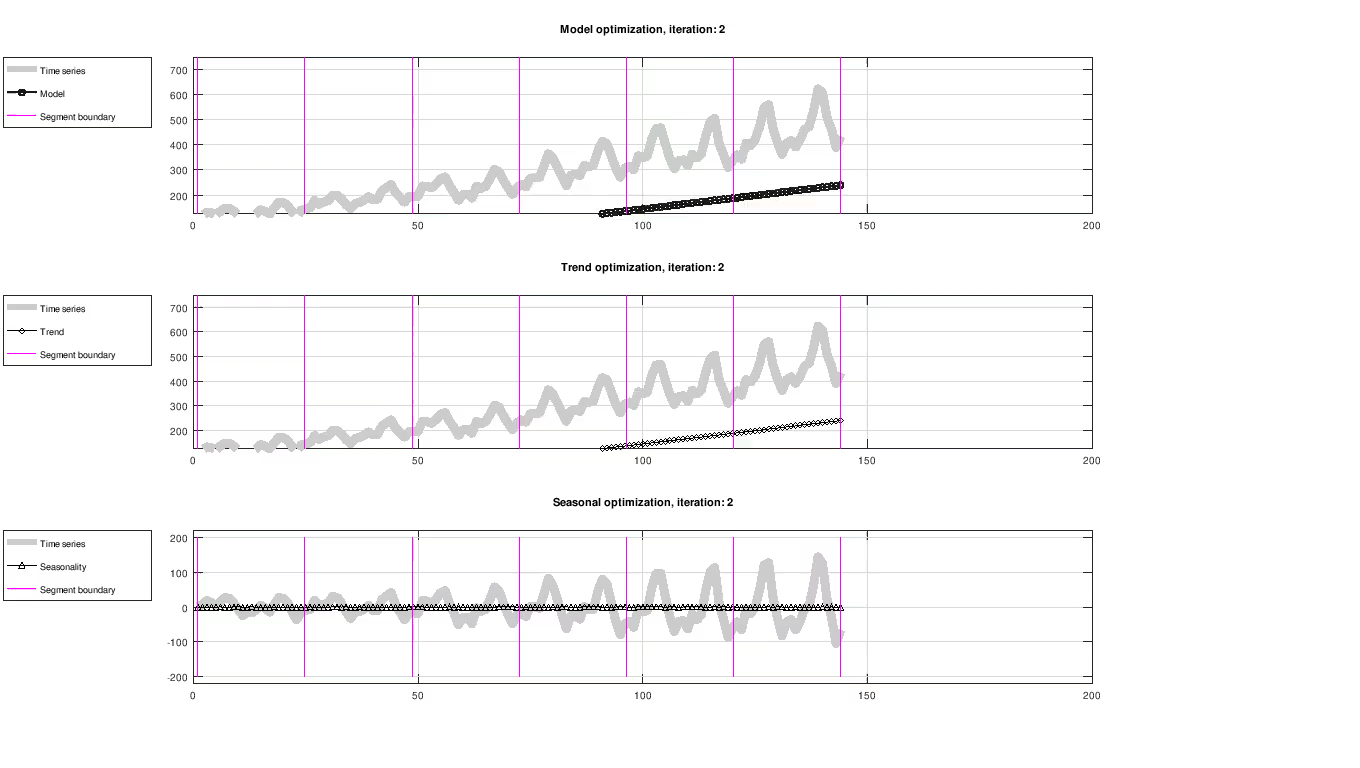 Figure: Evolution of trend and seasonality, showing full model fit (top), trend component (middle) and seasonal component (bottom). The seasonal component has been centered around zero for visualization purposes only.
The reference implementation of Prophet is found Github.
The second part of the paper discusses approaches for adding forecasting beyond the recorded time series and how to estimate its uncertainty.
References
- Sean J. Taylor, Benjamin Letham. 2017. Prophet: forecasting at scale. https://peerj.com/preprints/3190/
- Box, G. E. P., Jenkins, G. M. and Reinsel, G. C. (1976) Time Series Analysis, Forecasting and Control. Third Edition. Holden-Day. Series G.
Found an error? Report it by email and I will put your name and contribution in the article.